


Calculators · Indicators · Risk Management
Strifor Smart Lot Calculator eng version
Calculate MT5 position size from risk and stop-loss using manual inputs or chart lines. Includes risk limits and position sizing for multiple markets.
 Invest only the amount you are willing to lose. This is a risky investment with no principal protection.
STRIFOR / Trading Tools
Visualize Asian, European and US trading sessions, overlaps and market activity directly on your MT5 chart.
Session Volatility Map is a professional trading indicator that visualizes market behavior through the three key trading sessions: Asia, Europe, and the United States.
It helps traders instantly understand:
What the indicator shows
The indicator automatically marks:
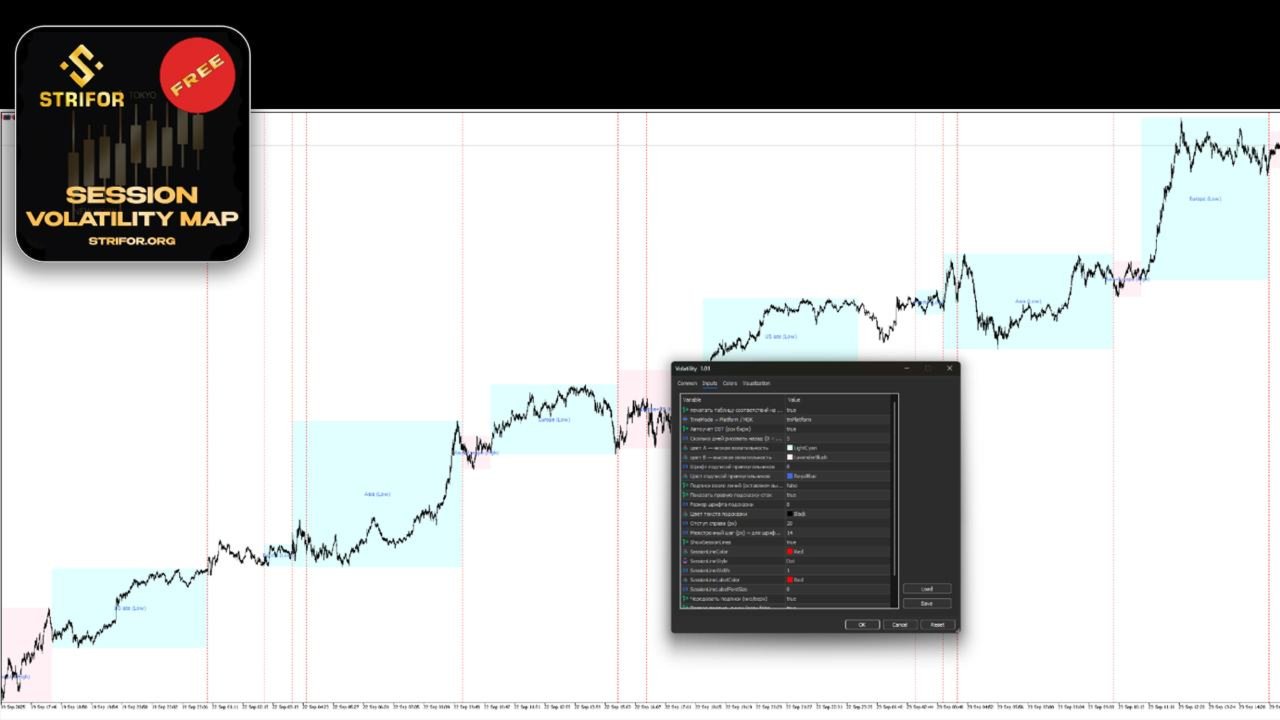
Each session is clearly highlighted on the chart, allowing you to instantly understand the structure of the trading day without manual time analysis.
Special focus is placed on session overlaps, where market activity typically increases.
These zones often produce:
Overlapping sessions are automatically highlighted as high-volatility areas.
For every trading session, the indicator plots:
These levels can be used as:
The indicator always displays:
No manual configuration is required:
Who this indicator is for
Key settings
The indicator is fully customizable to fit any trading style.
Core idea
Markets do not move randomly.
They move in session-driven phases:
Session Volatility Map visualizes this structure directly on the chart without manual analysis.
Summary
With this indicator, you can always see:
Download and install this tool through its official MQL5 product page. No EX5 file is hosted on this website. MetaTrader 5 and an MQL5 account may be required. Trading involves risk; tools do not guarantee results.
Images from the official MQL5 product gallery, in the original order. The publisher includes promotional illustrations and interface examples; these are not independently verified live-terminal screenshots.


Calculators · Indicators · Risk Management
Calculate MT5 position size from risk and stop-loss using manual inputs or chart lines. Includes risk limits and position sizing for multiple markets.
Utilities
Synchronize MT5 chart symbols and technical-analysis objects across Master and Slave charts while retaining each chart’s timeframe.

Indicators
Analyze MT5 market structure with VWAP, Volume Profile, POC and Value Area levels in one indicator.

Indicators
Combine classic pivot levels, ATR-based targets and an analytics panel for intraday and medium-term analysis in MT5.

Utilities
Send MT5 trade notifications to Telegram chats, groups or channels, including position events and changes to stop-loss and take-profit.

Risk Management · Utilities
Monitor daily, weekly and monthly trading results in MT5, set risk limits and receive warnings when configured thresholds are reached.

Utilities
Assist MT5 trade execution with configured risk, automatic stop-loss and take-profit placement, and compatibility with Strifor Lot Calculator.

Risk Management · Utilities
Manage account-level risk in MT5 with configurable loss limits and automatic actions when risk thresholds are reached.

Dashboards · Indicators
View real-time percentage price changes across hourly, daily, weekly, monthly and yearly periods in a compact MT5 dashboard.

